Michael's BOB Post
3 Things I know about graphing
1. I know that Graphing could be used for a lot of things like showing data but some graphs are different and should be used in different ways.Like how Line graph should be used for displaying data over time, Bar graph for showing which one is bigger and etc.
2. Most graphs need intervals. It doesnt matter what the intervals are but it would be better if it is good with the data.
example of a good graph:

Example of a bad graph:

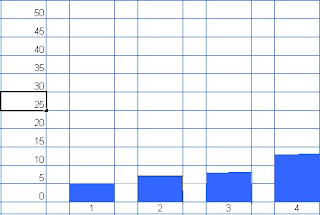
3.Graphs could be misrepresented by distorting the scale, distorting the visual, or distorting the size of bars.By Distorting the scale you can skip numbers.By distorting visuals you can make something look good and same as distorting the size of bars
Example of distorted scale:

Example of distorted visual:

Example of distorted size of bars:

What I know now that will improve my test:
I now know that just organising it by ascending order isnt good enough for something like this. For something like rolling the dices and how many times you got the sum you should do a tally of the number and the sum
The three pictures about misrepresented graphs is not mine thanks to whoever made them. Woohoo!! Extra marks.
2 comments:
Good job Michael lots of pictures.
Hi
Its Mr Montgomery from Australia here.
I am very impressed with the quality of your blog posts.
They are a great model for my year 8s
Post a Comment